Resveratrol:
Polyphenol Pathways to Youth
Resveratrol: Polyphenol Pathways to Youth
Abstract
Resveratrol is a plant-derived stilbene with pleiotropic anti-aging effects. It activates sirtuin pathways, enhances mitochondrial function, and reduces inflammation, offering a nutrigenomic route to longevity.
Introduction
Resveratrol gained attention through the 'French Paradox' and its ability to mimic caloric restriction. At the molecular level, it influences transcriptional regulators like SIRT1 and AMPK, improving cellular energy homeostasis and stress resistance.
Mechanism of Action
Resveratrol activates SIRT1, enhancing mitochondrial biogenesis and antioxidant defense. It reduces NF-κB signaling, suppressing chronic inflammation linked to age-related disease.
Scientific Evidence
• Studies in mice have shown resveratrol improves insulin sensitivity and extends lifespan under high-fat diet conditions.
• In vitro research supports its role in protecting endothelial cells and reducing oxidative damage.
Conclusion
Resveratrol represents a potent natural activator of longevity pathways. Its polyphenolic actions promote cellular balance and metabolic resilience.
References
Baur, J. A., Pearson, K. J., Price, N. L., Jamieson, H. A., Lerin, C., Kalra, A., ... & Sinclair, D. A. (2006). Resveratrol improves health and survival of mice on a high-calorie diet. Nature, 444(7117), 337–342. https://doi.org/10.1038/nature05354
Lagouge, M., Argmann, C., Gerhart-Hines, Z., Meziane, H., Lerin, C., Daussin, F., ... & Auwerx, J. (2006). Resveratrol improves mitochondrial function and protects against metabolic disease by activating SIRT1 and PGC-1α. Cell, 127(6), 1109–1122. https://doi.org/10.1016/j.cell.2006.11.013
Ready to activate the power of polyphenols?
Anti-Glycation Brightening Complex™
supports longevity at the cellular level—naturally.
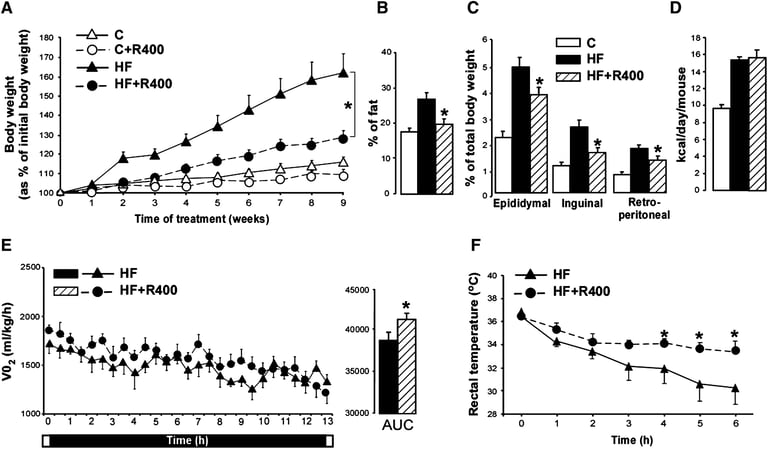
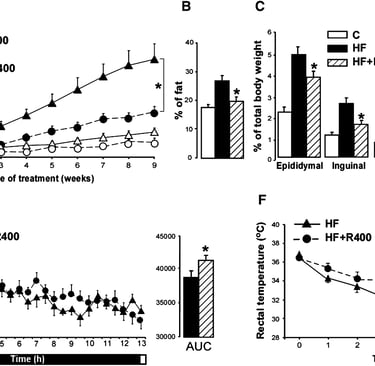
Figure 1 RSV Prevents Diet-Induced Obesity
C57Bl/6J mice were fed a chow diet (C) or high-fat diet (HF) alone or supplemented with RSV (400 mpk, R400) for 15 weeks.
(A) Evolution of body weight gain expressed as percentage of initial body weight.
(B) Body fat content expressed as percentage of total body mass as analyzed by DEXA.
(C) Weight of the WAT depots, expressed as percentage of total body weight.
(D) Average food intake expressed as kcal/mouse/day.
(E) EE as measured by changes in VO2 consumption in indirect calorimetry during 13 hr (time 0 is 7:00 p.m.). The mean areas under the curves (AUC) are shown in the right side graph (n = 7).
(F) The evolution of the body temperature during a cold test (4°C for 6 hr). ∗ = P < 0.05 and n = 10 animals/group unless stated otherwise. Values represent means ± SEM.
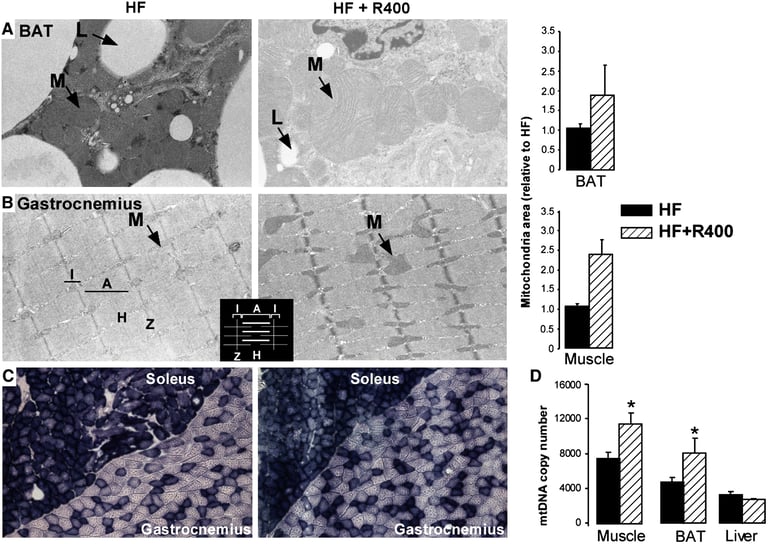
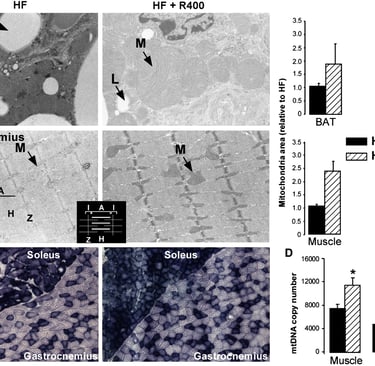
Figure 2 RSV Increases Mitochondrial Activity in the BAT and Muscle
(A and B) Transmission electronic microscopy (magnification of 20,000) image and corresponding quantification of mitochondria size in BAT (A) and nonoxidative fibers of gastrocnemius muscle
(B) from RSV-treated (HF+R400) and nontreated HF-fed animals. Arrows indicate the position of mitochondria (M) and lipid droplets (L), and the inset shows the schematic organization of muscle fiber anatomy. Quantification was performed on 2 animals/group and is expressed relative to HF controls.
(C) SDH staining of gastrocnemius and soleus muscle from RSV-treated and nontreated HF-fed animals.
(D) mtDNA copy number of gastrocnemius muscle, BAT, and liver from RSV-treated and nontreated HF-fed mice (n = 4 animals/group). Values represent means ± SEM.
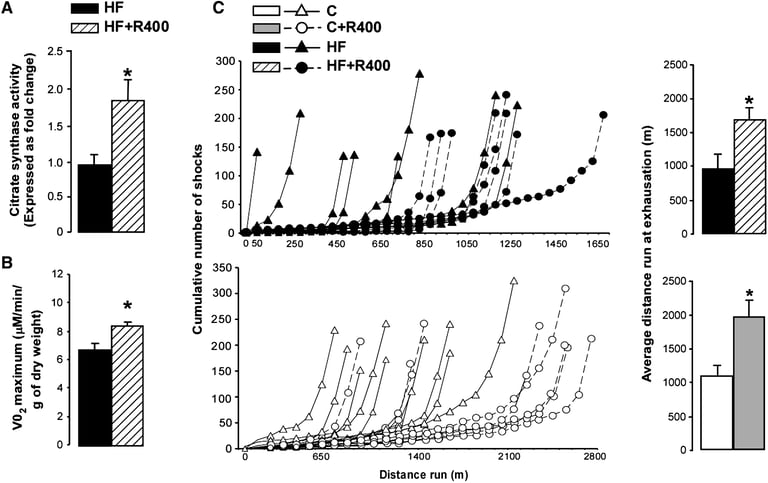
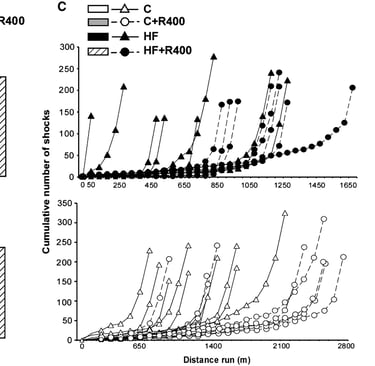
Figure 3 Enhanced Oxidative Capacity and Endurance in RSV-Treated Mice
(A) Activity of the citrate synthase, as measured in homogenates of gastrocnemius fibers isolated from RSV-treated (HF + R400) and nontreated HF-fed mice. N = 3 animals/group, and values are expressed relative to control.
(B) Maximum VO2 consumption in isolated gastrocnemius fibers measured ex vivo. N = 5 animals/group.
(C) The effect of RSV on endurance, as measured by an exercise test. Individual animal performances (graphs on the left) as well as the average distance run until exhaustion (graphs on the right) are presented for animals treated with HF or HF + R400 (top) or chow diet (C) or chow diet and RSV at 400 mpk (C + R400) (bottom). N = ∼8 animals/group. ∗ = P < 0.05. Values represent means ± SEM.
Envilt
Age Well, by Design!
Contact Us
Sign up
hello@envilt.com
+44 (0)2045723984
© Envilt 2025. All Right Reserve.
ENVILT
®
Follow Us
ENVILT® is a registered trademark of Nova Skincare & Wellness Brands Holding Ltd
Company No. 11479600 · Registered in England & Wales Address:86-90 Paul Street, London EC2A 4NE
®
Nova Skincare & Wellness Brands Holding Ltd is a Made in Britain® member